How to use it
Reproduce the slowdown with a fixed machine, window size, fonts and package version. Separate wall time, work counts, submitted frames and resource samples. A screenshot demonstrates appearance, not interaction smoothness.
Integration and limits
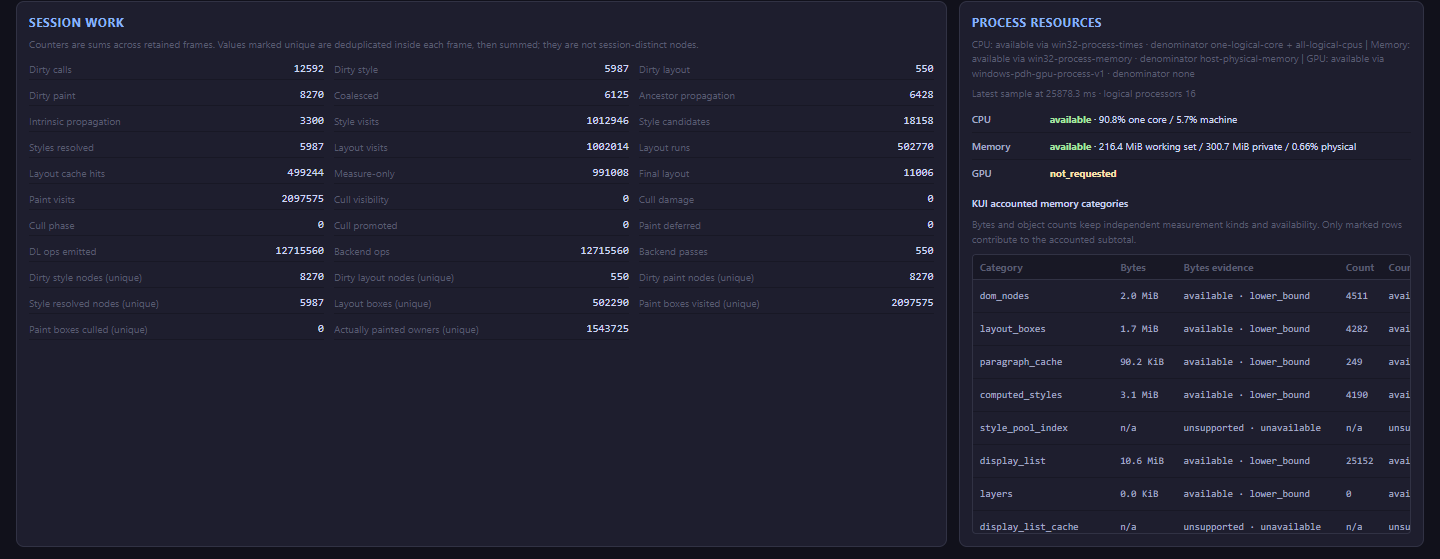
Enable DevTools recording for the target scenario and account for recording overhead. Estimated cost rankings are not per-node CPU/GPU measurements. Interpret field units and denominators using the versioned field guide. Retest the same scenario and record memory costs.
Frame work and presentation
Performance.renderStats workFps describes frame production, while presentFps describes presentation. In a headless environment without vsync, presentFps does not prove real-window smoothness. Whole-frame reuse via framesReused differs from partial-damage hit rate.
Recording modes and fields
summary, timeline, attribution and deep-trace provide increasing recording detail. Requested categories may promote the effective mode; inspect effectiveConfig.mode. Interpret damage ratios with their declared viewport denominator rather than mixing layout viewport, surface size and external derived metrics.
First-use interfaces
The Windows GPU path supports kui-preload on templates or hidden content to prepare drawing programs after the first frame. Warmup adds startup work and memory, so apply it to likely-to-open interfaces. Compare the same scenario with KUI_DISABLE_PRELOAD_WARMUP=1 and measure the application’s result.
<template kui-preload>
  <dialog class="settings-dialog">
    <h2>Settings</h2>
    <button>Save</button>
  </dialog>
</template>
Run a useful performance comparison
Fix the viewport, dataset, build and interaction, changing one condition at a time.
- Record versions, configuration, viewport, scale and dataset size.
- Measure first use and repeated use separately rather than reporting warm results as first use.
- Compare frame timing and work counts alongside process memory.
- Check for ongoing work while idle, including timers and animations.
- Keep raw records and the method; do not equate headless measurements with desktop smoothness.
Investigate by phase
Use the symptom to narrow the cause before editing.
| Symptom | Check and action |
|---|---|
| Many nodes or slow scrolling | Reduce persistent DOM with a virtual list; inspect whether rendered rows follow the viewport rather than total records. |
| Large relayout on every keystroke | Check for whole-page replacement in handlers and update only necessary state or text. |
| Slow first dialog open | Record first and subsequent opens separately, checking resource and drawing preparation; warmup costs memory. |
Something unclear?
Report an issue on this page →